October 2020- The numbers..
Our team is finally combing through all the October numbers in the region… Wow! Some crazy increases happened (and all through a pandemic) Read on below and click on the links to see all the Rahb Stats for October 2020.
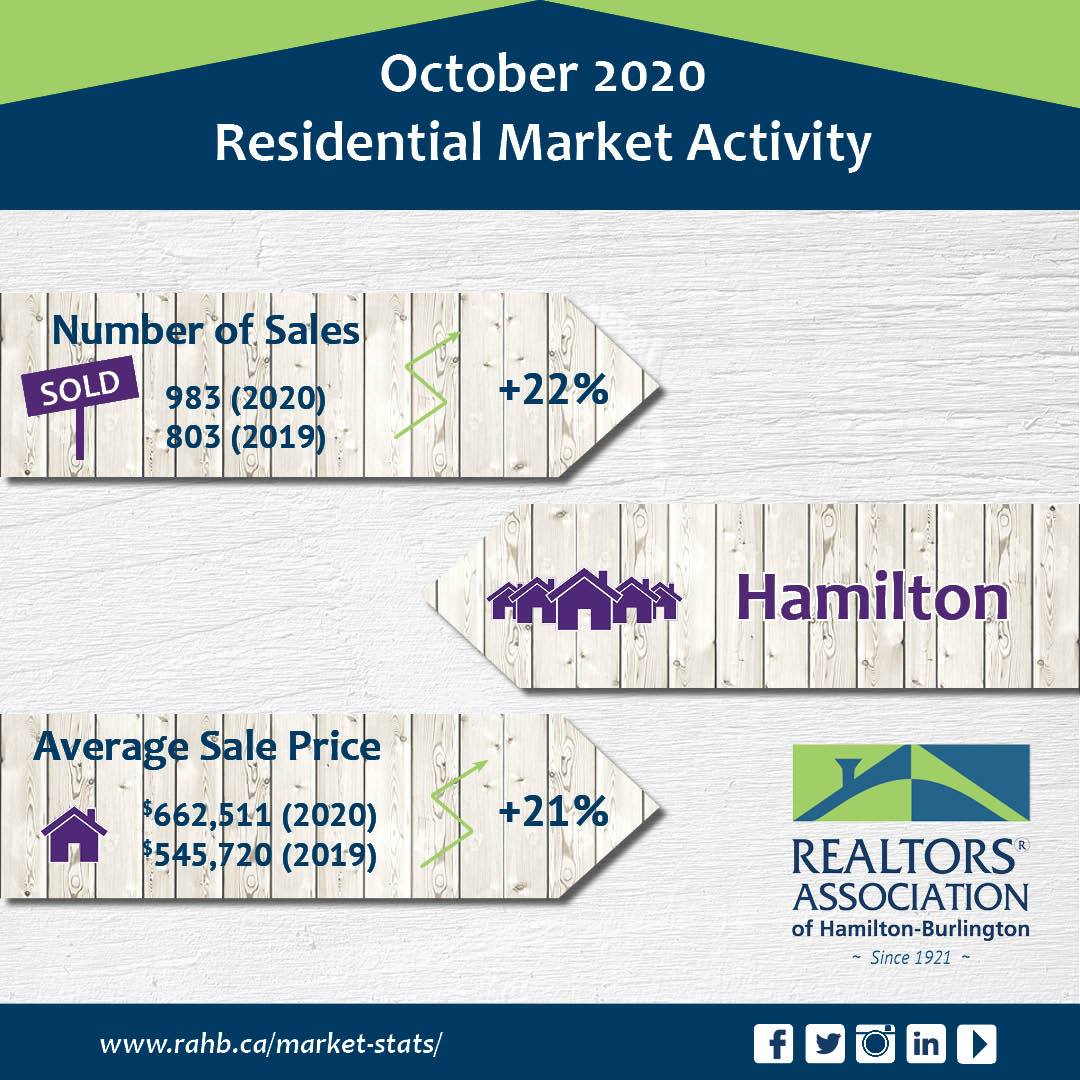
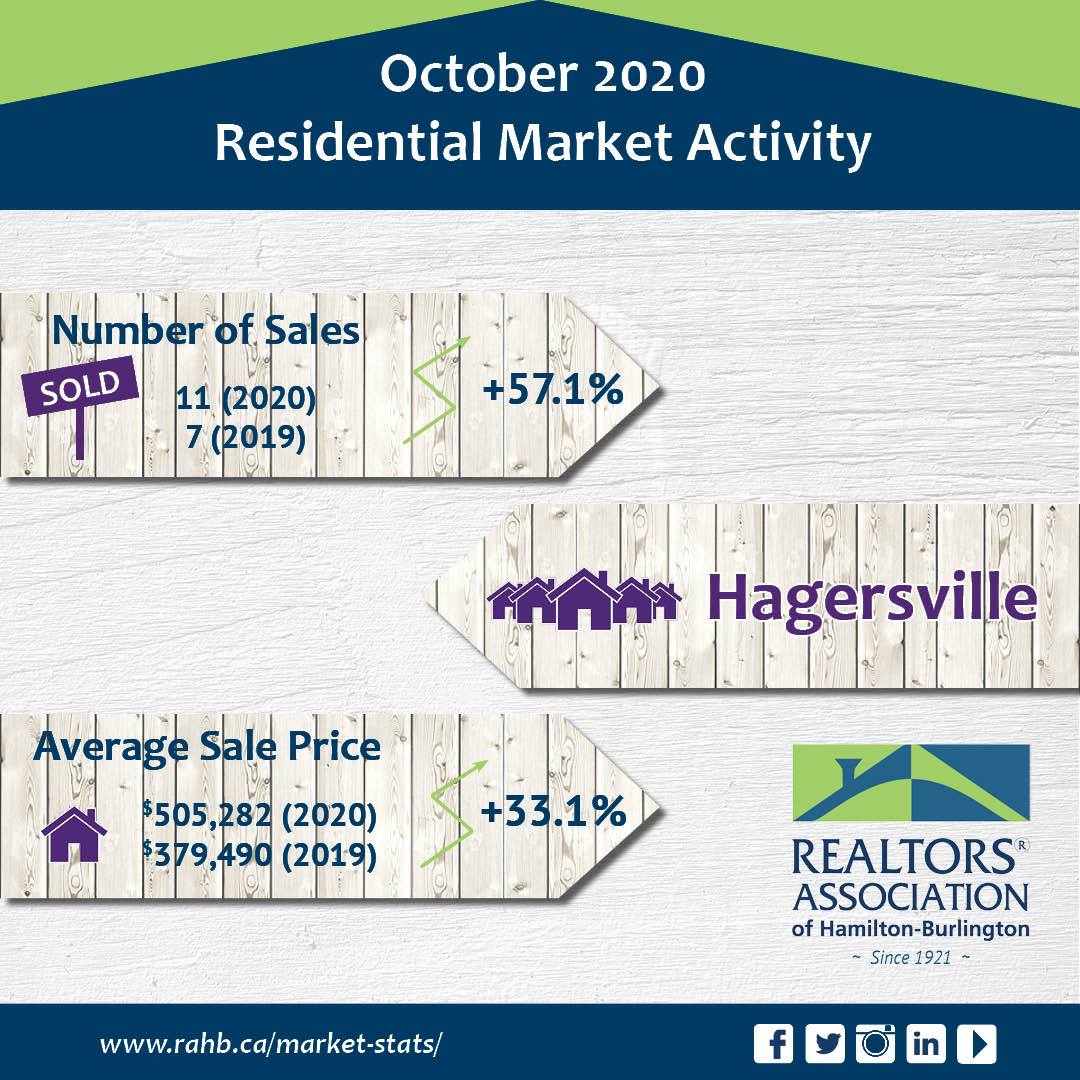
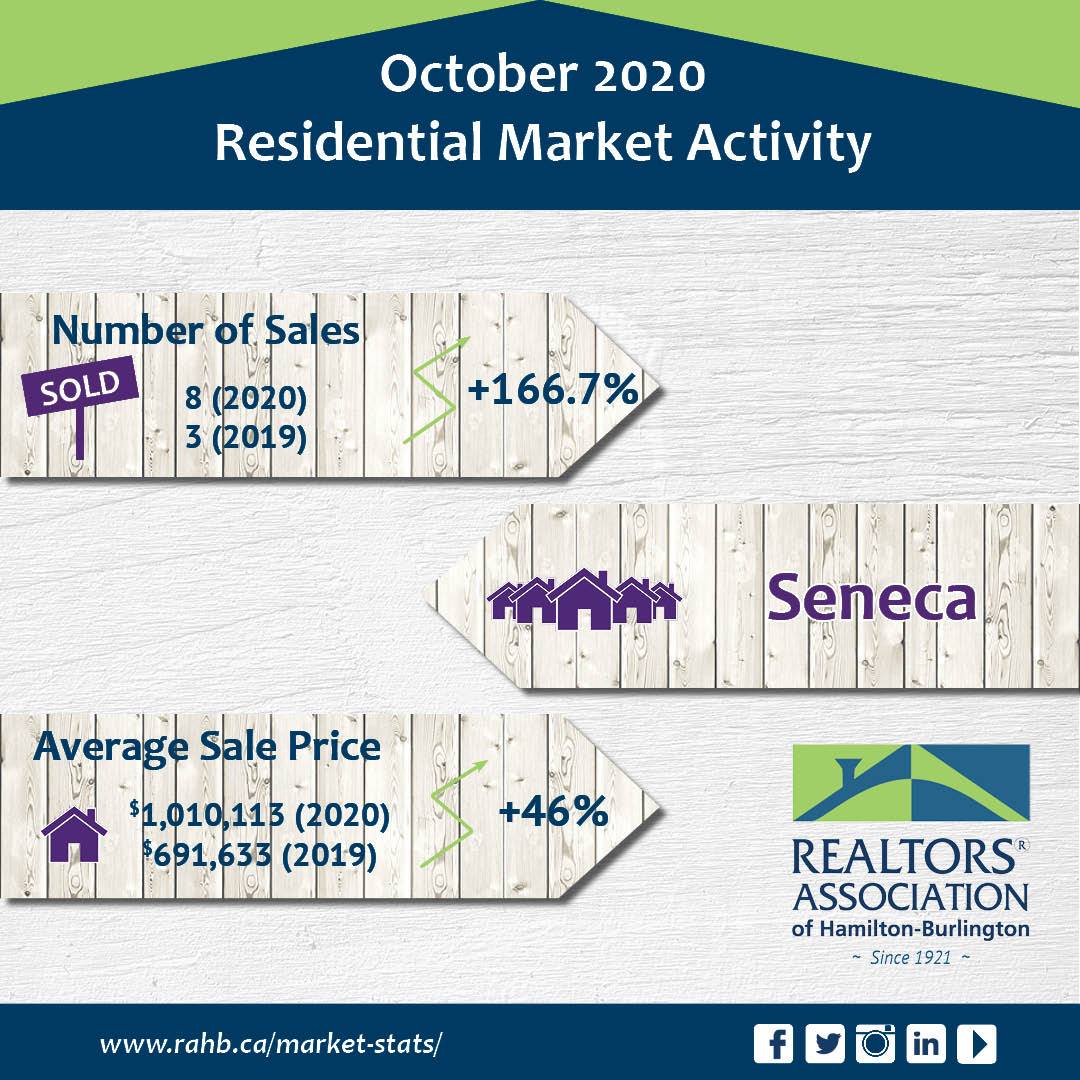
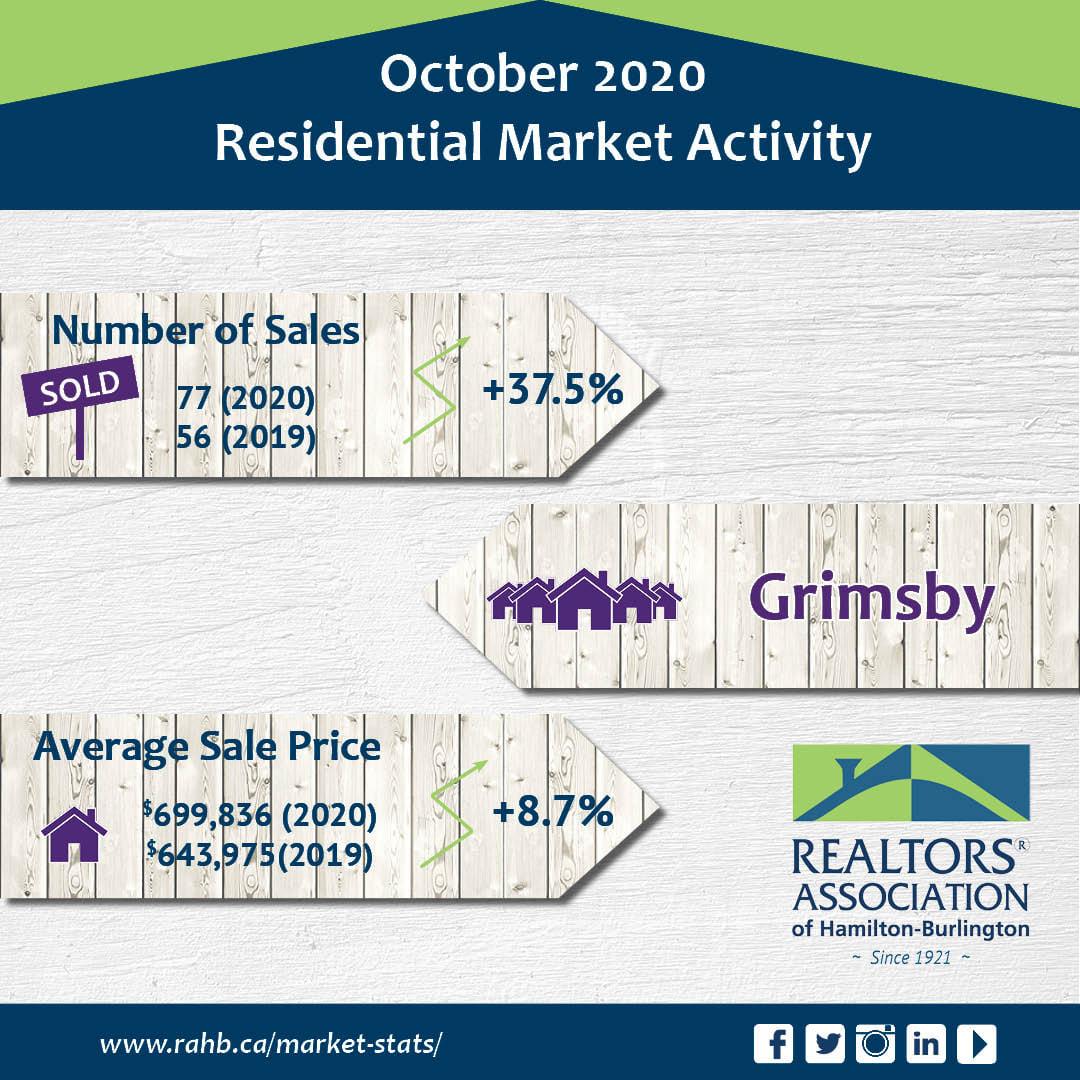
As you can see from the stats below, from October 2019 vs 2020, the numbers increased dramatically, both in terms of volume of sales as well as value increase.
While Burlington saw a 13.9% increase, which is considered quite healthy, some other areas saw even more… Check out Cayuga at 28.7% increase in value, Flamborough at 48.3%, Hamilton Centre at 24.7% up & Waterdown at 16.9% increase. Keep in mind, these are averages, pulled from the boards, so if you have specific questions about specific areas, our team can help you go through particular areas, housing types etc. But even given that, we think these increases are still pretty incredible.
When we’re looking at these numbers, it’s important to see the bigger picture. Ever see a postcard come through the mail boasting general large increases across the board? We don’t do that, and there’s a reason for it. One big general number doesn’t necessarily tell the full picture. When we’re looking to help you buy or sell a property, we want to look at specific areas, housing types, as well as how many days on market is the current average? Is it a multiple offers type of market?(currently yes!) Are the prices consistent; or are they inconsistent? How will this affect your strategy? If we’re pricing to sell your home, are there any gaps in pricing from one area or type (ie. townhouse vs detached) to the next? Is there an opportunity to take advantage of these gaps to get you more? For home buyers, in a multiple offer market, we want to make sure we’re playing the game right as well, so that you can win without overextending yourself or going too far above perceived market value.
Are you considering an investment property? Then let’s pay attention to those gaps in a different way. We can help you navigate all this to help you get into a solid investment and forecast where the best returns are. You know what they say, the best time to invest was always yesterday. If you are exploring an investment property, we’re going to be looking for opportunities to get you into an area or price point that will help you see a solid increase in a short amount of time. There’s so much to consider. And we’re here for you.
The bottom line is that when you’re dealing in real estate whether for personal property or investments, you need to know your numbers. It’s also important that you are working with someone you trust, someone who will do the work and put in the time to make sure the numbers work. When we’re dealing with a purchase or sale for you, we will take the time to crunch the numbers (inside out and sideways). We’ll explore all the options with you to see where the gaps work FOR you, because we want our clients to be successful and we want to see you crush this.
Check out the RAHB stats below for October 2020… And give us a call! Even if just for our opinion or some advice. We’re here for you & we’re here to help.